

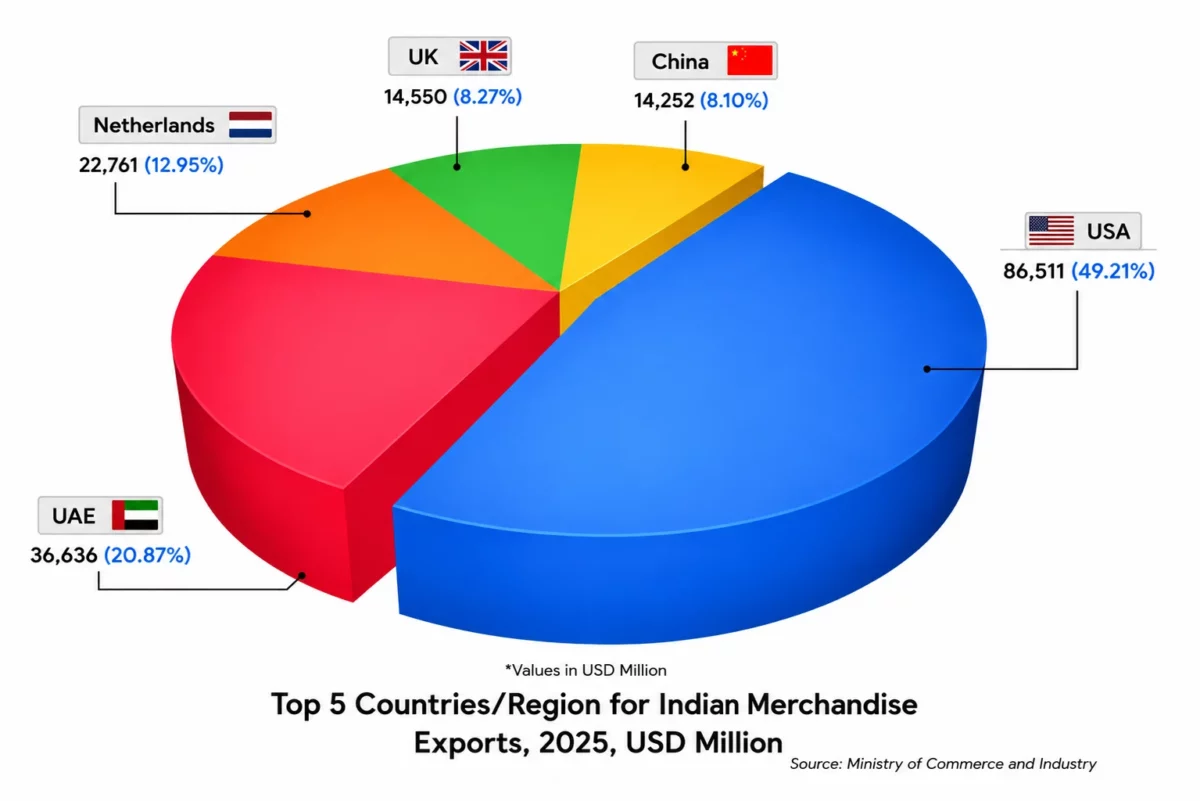
India has a strong relationship with the United States spanning trade, investment, technology, and defence. In the financial year 2024–25, India exported approximately 8,177 commodities (HS-8 tariff lines) to the United States. India’s exports to the US reached approximately USD 86.5 billion in FY 2024–25, up from USD 77.5 billion in FY 2023–24. Major exports from India to the United States include pharmaceutical products, electrical machinery and equipment, engineering goods, natural or cultured pearls and precious or semi-precious stones, organic chemicals, petroleum products, textiles and apparel, and machinery.
India-US Relations: A Look at Key Numbers
Both the countries have been focusing on strengthening their partnerships and as a result, there has been a significant increase in trade and investment between the two nations over the past few years.
For India, the United States is a major source of foreign direct investment and tourism. The US has emerged as the 3rd largest investor in India, with cumulative FDI inflows of approximately USD 70.65 billion during the period from April 2000 to March 2025. As per the latest data from the U.S. Mission to India, more than 2 million U.S. visas were processed in India during 2024, making it the highest number ever issued in a single year. This included over one million non-immigrant visas, reflecting the continued growth in travel, business, education, and tourism between the two countries.
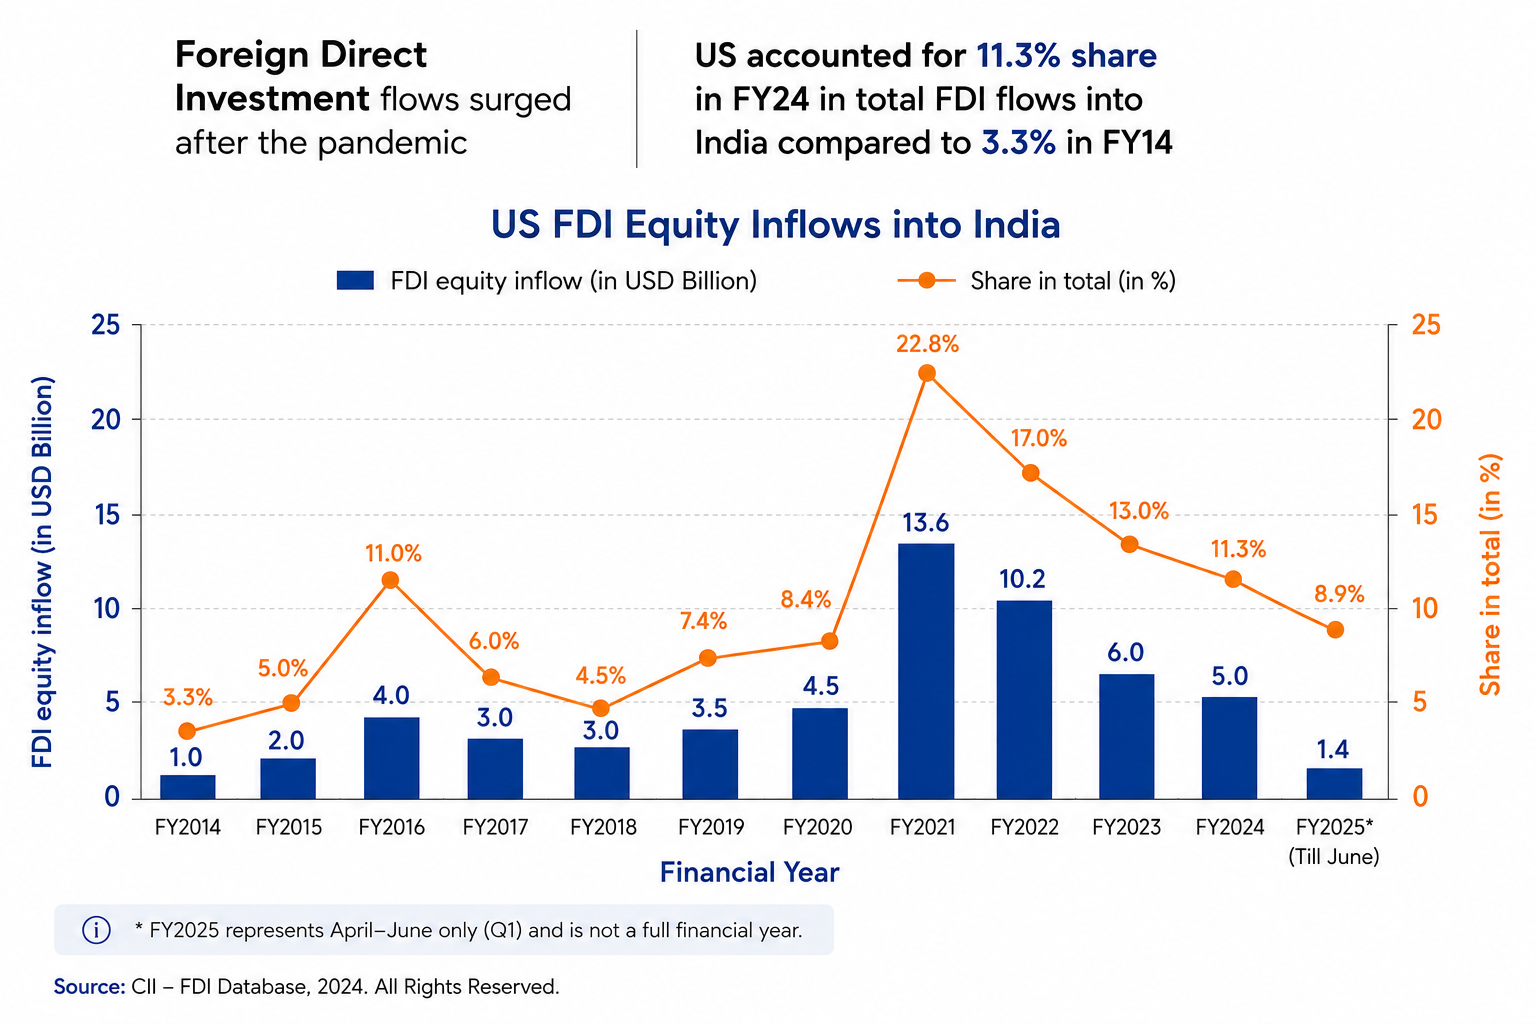
Key Export Categories from India to the USA
Key export categories for India to the US include electrical equipment and machinery, precious and semi-precious stones, pharmaceutical goods, and petroleum jelly.
Table: Top Commodities Exported from India to the US Apr’23 – Mar’24 ($Mn)
| Rank | Commodity |
Export Value (US$ Million) |
|---|---|---|
| 1 | Natural or cultured pearls, precious & semi-precious stones, precious metals, jewellery & coins | 9,970 |
| 2 | Pharmaceutical products | 9,830 |
| 3 | Electrical machinery & equipment | 8,420 |
| 4 | Nuclear reactors, boilers, machinery & mechanical appliances | 7,940 |
| 5 | Mineral fuels, oils & petroleum products | 5,860 |
| 6 | Organic chemicals | 4,910 |
| 7 | Apparel & clothing accessories (knitted and non-knitted) | 4,420 |
| 8 | Iron and steel articles | 3,760 |
| 9 | Vehicles and auto components | 3,310 |
| 10 | Medical & surgical instruments | 2,890 |
| Total Merchandise Exports to the US (Apr’24 – Mar’25) | US$ 86.51 Billion | |
Note: Values are rounded to the nearest US$10 million.
Natural or cultured pearls, precious or semi-precious stones, coins, and imitation jewellery together formed one of the top three export items, standing at a value of approximately USD 9.97 billion during FY 2024–25. Assessing the growth potential of India’s gems and jewellery sector, the Indian government has declared it as a key area for export promotion.
Besides, the United States has emerged as the largest export destination for Indian merchandise. In 2024–25, merchandise exports from India to the US reached approximately USD 86.51 billion. As of the first quarter of FY 2025–26 (April–June 2025), India’s merchandise exports to the United States stood at approximately USD 25.52 billion.
Figure: Top 5 Countries/Region for Indian Merchandise Exports, 2024 (Apr-Sep), USD Million
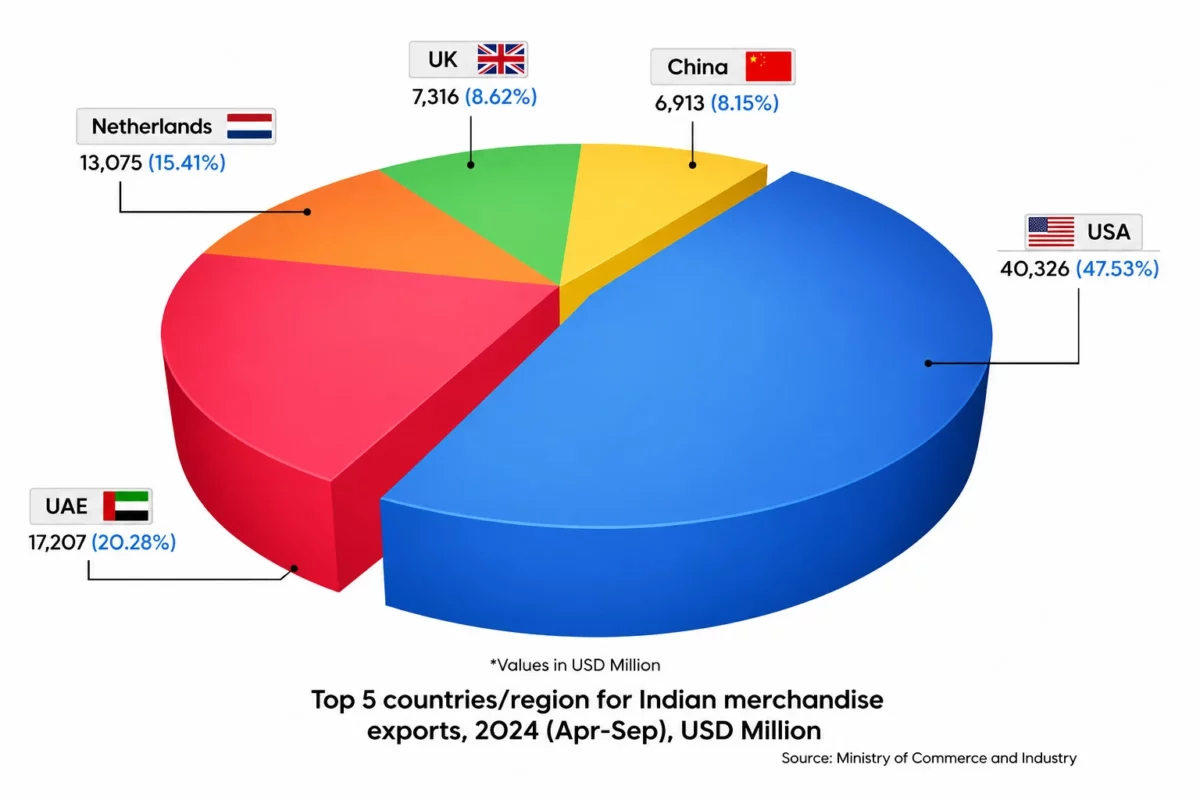
Figure: Top 5 Countries/Region for Indian Merchandise Exports, 2025, USD Million
Key Products Imported from the US to India
The major products imported to India from the US are mineral fuels and oils, precious metals, machinery, electrical equipment, aircraft and parts, and medical instruments. As of FY 2024–25, the United States accounted for approximately 6.3% of India’s total imports.
Indian Diaspora
The number of Indians living in the US has been continuously increasing. According to the latest estimates, the United States is home to more than 5.2 million people of Indian origin as of 2025.
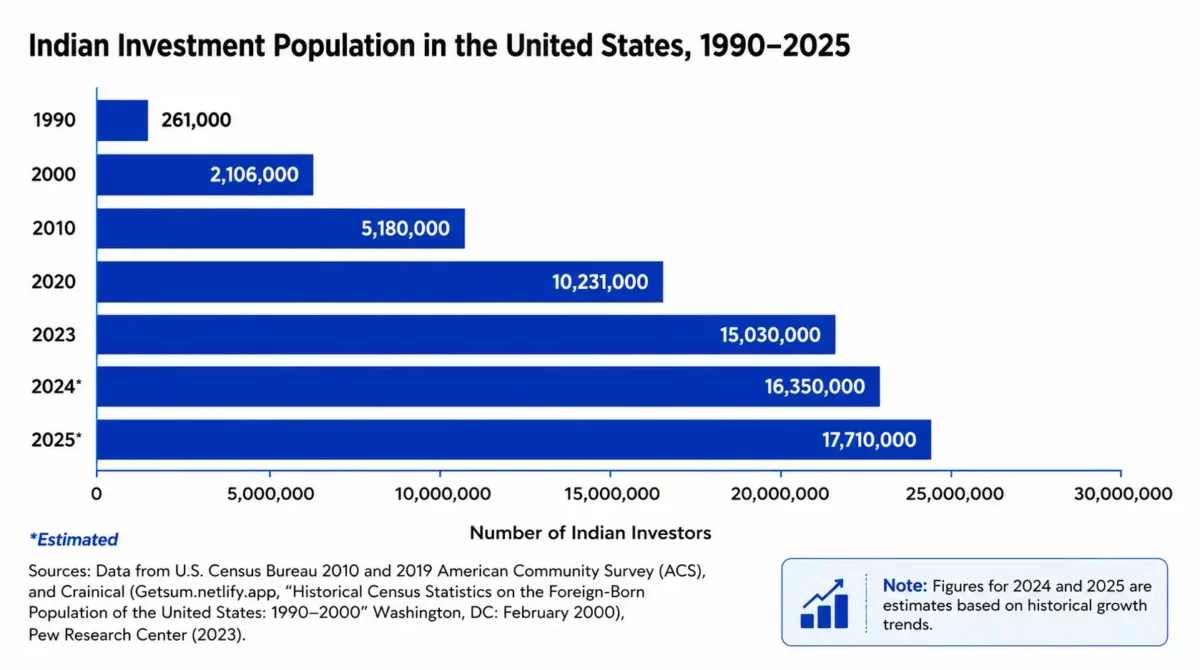
After Mexicans, Indians represent the second-largest immigrant group in the United States. Indians are followed by Chinese and Filipinos, respectively. As of 2021, 2.7 million Indian immigrants living in the US formed 6% of the total foreign-born population, and these numbers have since then grown rapidly.
Conclusion
India-US relations are unlikely to see any major changes and are expected to continue to remain strong in the coming years.
The increasing focus of the U.S. government on reducing its reliance on Chinese imports is expected to open new opportunities for Indian exporters, thus benefiting sectors like textiles, auto parts, and pharmaceuticals.
Proactive government initiatives are expected to play a pivotal role in easing trade regulations and promoting digital trade, thus boosting exports.